
Contact us

Why 79% of Organizations Overspend on AI and How to Budget Better

17 mins read

Why 79% of Organizations Overspend on AI and How to Budget Better
Blog Calculator Widget Logo

Estimate Your Software Project Cost

Describe your idea — get a budget breakdown in minutes.

Get Your Estimate

AI features rarely fail during a demo. They usually fail a few months after launch, when finance asks why the AI assistant is costing far more than anyone expected.

This is a common problem. A survey of 500 finance leaders by DoiT and Sapio Research found that ⁠79% of enterprises have experienced AI cost overruns. Organizations with the most mature FinOps practices reported an average overspend of 30.9%—the highest of any group. The reason isn’t that they manage costs poorly. Mature teams are simply better at measuring and uncovering spending that other organizations often overlook.

The problem usually starts much earlier, during planning. Many teams build their budget around a single estimate based on a single usage scenario. In reality, AI costs depend on several variables that change over time, and focusing on just one almost guarantees an inaccurate forecast.
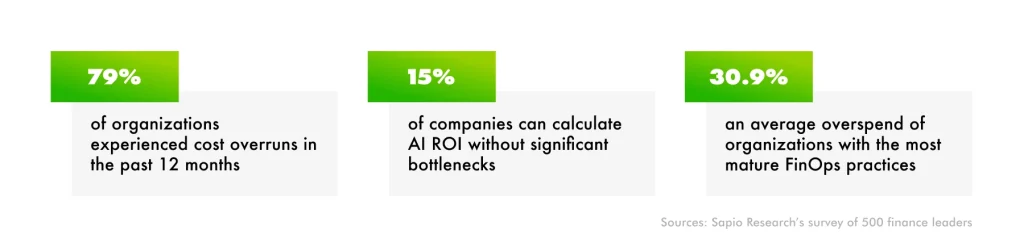
Organizations with the most mature FinOps practices reported an average overspend of 30.9%

This article introduces a practical framework for estimating AI costs before development begins. We’ll walk through the five variables that have the biggest impact on cost, show you how to calculate the cost of a single AI request, and explain how to build three budget scenarios that reflect real-world usage instead of best-case assumptions.

If you’d like to understand what drives those costs, including why output tokens are more expensive, how context windows affect pricing, or where “invisible” tokens come from, start with the first article in this series, then come back here.

What Makes AI Costs Hard to Budget?

AI costs are hard to budget because they don’t scale with infrastructure, but with user behavior. A server costs the same whether users write short questions or long ones. A language model bills for every token in every request, so conversation length, document size, and feature scope all directly affect the bill.

That does not make the bill unpredictable. It makes it a function of five variables you can estimate, and each one is a product decision before it is an engineering one.

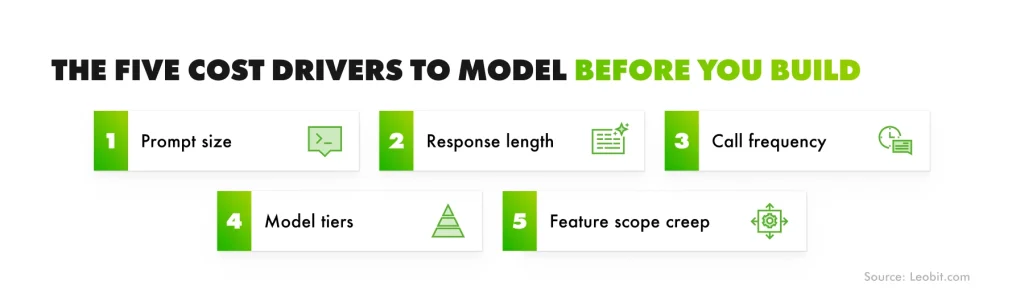
The Five Cost Drivers to Model Before You Build

Most AI budgets start with a single question: How many requests will this feature handle? That’s an important input, but it’s only one part of the equation. In practice, the cost of an AI feature is shaped by five decisions made during product design and engineering. Some determine how much a single request costs, while others determine how often that cost is incurred.
5 AI Cost Drivers

Prompt size

Most teams estimate AI costs based on request volume. That’s only part of the picture. Prompt size is just as important, yet it’s easy to overlook because users never see most of it.

When someone types a short question, that’s only a small part of what gets sent to the model. Every request also includes the system prompt, tool definitions, and often retrieved context from a knowledge base. Those hidden components frequently account for most of the input tokens, and so, most of the cost.

On a single request, the difference may seem negligible. But AI features process thousands or even millions of requests. A system prompt that’s 2,000 tokens longer than necessary adds only a fraction of a cent to each call, yet at a sustained rate of 10 requests per second, that overhead can amount to roughly $50,000 per year. The feature isn’t doing more work or providing more value—you’re simply paying to send the same extra instructions over and over again.

This is why prompt engineering is also cost engineering. Long before you compare GPT, Claude, or Gemini pricing, you’ve already determined a large part of what every request will cost. Two teams can build the same feature on the same model and end up with very different operating costs simply because one team was more disciplined about what went into the prompt.

A common example is a system prompt that has grown over time. It starts with a few instructions, then accumulates redundant rules, lengthy formatting examples, deprecated guidance, and tool definitions that are no longer used. None of that looks expensive during development, but every unnecessary token becomes a recurring cost in production. That’s why prompt optimization is often one of the quickest and most effective ways to reduce AI spending after launch.

Response length

Since output tokens carry a 5 to 6 times price premium over input tokens, how verbose a feature’s responses need to be is one of the most consequential cost decisions a product team makes. It is almost always made implicitly.

Consider how differently these use cases behave, purely based on the shape of the expected answer:

Typical output shape
Approx. output tokens
Relative output cost

Sentiment classification

Single label

~5 tokens

Baseline

Structured data extraction (JSON fields)

Compact structured output

~80 tokens

~16× baseline

Short summary of a document

3–4 sentence summary

~150 tokens

~30× baseline

Drafted email or short report section

Full paragraph(s)

~350 tokens

~70× baseline

Long-form report or full document draft

Multi-page output

~2,000+ tokens

~400× baseline

The exact figures vary by task, but the spread is the point. Two features on the same model at the same call volume can differ in output cost by two orders of magnitude, and the difference is decided entirely by how much the feature is asked to say. A hard word limit or a strict output schema is a direct, controllable cost lever, and one of the few that can be implemented in an afternoon.

Call frequency

Prompt size and response length determine the cost of a single request. Call frequency determines how often you pay that cost.Two factors drive it: how many people use the feature and how often they interact with it. On their own, neither may seem significant. Together, they multiply.

The formula is simple enough to run in a spreadsheet, but the compounding effect is easy to underestimate until it’s explicitly laid out:

Monthly cost ≈

Daily Active Users × Sessions per user per day × Calls per session × Cost per call × 30

Even small changes can have a surprisingly large impact:

DAU
Calls per user per day
Cost per call
Monthly cost

Pilot

500

5

$0.02

~$1,500

Early growth (more users)

10,000

5

$0.02

~$30,000

Higher engagement

10,000

15

$0.02

~$90,000

Scaled adoption

100,000

15

$0.02

~$900,000

The first increase comes from attracting more users. The second comes from existing users interacting with the feature more often. Both are signs that the product is succeeding, but both increase costs.

In practice, the numbers can grow even faster than this table suggests. As users have longer conversations or complete more complex tasks, prompts and context windows often become larger, increasing the cost of each request as well. In other words, higher engagement can raise both the number of requests and the cost of every request.

A cost model that only reflects pilot-scale usage isn’t wrong on the day it’s written; it becomes wrong the moment the feature starts succeeding.

Denys Korpan

Denys Korpan

Senior .NET Engineer

That’s why budgeting only for pilot-scale usage is risky. A cost model should reflect how the feature is expected to behave after adoption, not just during the first few weeks after launch. Otherwise, the budget starts looking unrealistic at exactly the moment the product begins to gain traction.

Model tiers

Model tier is usually a single line in a config file, which makes it the easiest lever to get wrong by simply never looking at it again. A team picks the flagship model during a demo because it produces the most impressive output, and that choice quietly becomes the permanent production default.

The gap is larger than most stakeholders assume. Moving from a budget-tier model to a flagship model within the same provider’s lineup runs 5 to 6 times more expensive per token: compare Claude Haiku 4.5 at $1/$5 per million tokens with Claude Opus 4.8 at $5/$25. Historically, the spread has been even wider for tasks that both tiers handled with comparable accuracy.

For instance, GPT-4o costs roughly 16 times more per token than GPT-4o-mini for tasks that both models could handle with comparable accuracy. This means teams defaulting to the larger model often paid a multiple for zero measurable quality benefit on their specific task.

The question worth forcing into every model discussion is never “which model performs best?” On almost any benchmark, the answer is the newest, most expensive one, which tells you nothing useful. The question is: what is the cheapest model that clears our current quality bar for this specific task? A support triage feature routing tickets into five categories almost certainly does not need the same model as a feature drafting client-facing proposals.

Feature scope creep

The cost estimate you create before launch reflects the feature as it exists on launch day. The problem is that AI features rarely stay the same for long.

New capabilities get added over time—tool calling, image understanding, larger document support, web search, and countless smaller improvements. Each one changes the cost of every request, yet these changes are rarely treated as budget events. They’re seen as incremental product enhancements, so the original estimate quietly becomes outdated.

Cost impact
Why it’s often overlooked

Tool use/function calling

+290–590 tokens on every request, even if no tool is called

The overhead is added whenever tool use is enabled

Image input

A 1024 × 1024 image adds roughly 1,600 tokens

Feels like a UI enhancement rather than a cost increase

Larger documents or longer context

Costs grow roughly in proportion to document size

Testing usually happens with small examples, not real user data

None of these changes looks expensive on its own. A few hundred extra tokens per request doesn’t sound like much. But once the feature is serving thousands of users, even small increases become significant.

There’s another effect that’s easy to overlook. New capabilities often encourage people to use the feature more frequently. Adding image analysis or web search doesn’t just make each request more expensive—it can also increase the number of requests users make. The result is a higher cost per request multiplied by higher usage.

For that reason, every meaningful addition to an AI feature should trigger a new cost estimate. The same discipline you apply before launch should also apply after launch. From a budgeting perspective, adding image support or enabling tool use isn’t just another product enhancement—it changes the operating cost of the feature and deserves to be evaluated as such.

How to Calculate Cost-Per-Call Worksheet

The five drivers we’ve covered determine the cost of a single AI request. Put them together, and you have a simple worksheet you can reuse whenever the feature changes.

Base case
After scope expansion + model upgrade

Avg. prompt tokens (system + context + user message)

1,200

1,900

Avg. output tokens

300

300

Model input price ($/million tokens)

$3.00

$5.00

Model output price ($/million tokens)

$15.00

$25.00

Calls per day

20,000

20,000

Cost per call

$0.0081

$0.0170

Monthly cost

≈ $4,860

≈ $10,200

In this example, user adoption remained unchanged. The feature still handles 20,000 requests per day and generates responses of the same length. The only differences are a longer prompt, caused by adding tool support and more retrieved context, and switching to a more capable model.
Those two changes more than double the monthly operating cost.

This is exactly why AI budgets shouldn’t be treated as one-time estimates. Every significant change to the feature, a new capability, a longer prompt, a different model, or a shift in usage patterns changes the economics. Recalculating the cost takes only a few minutes, but it helps prevent small product decisions from turning into large budget surprises months later.

Three Budget Scenarios: Why One Number Is Never Enough

The companies behind the AI cost-overrun statistics didn’t necessarily make bad estimates. Most simply planned for one scenario, while real usage turned out to be very different.
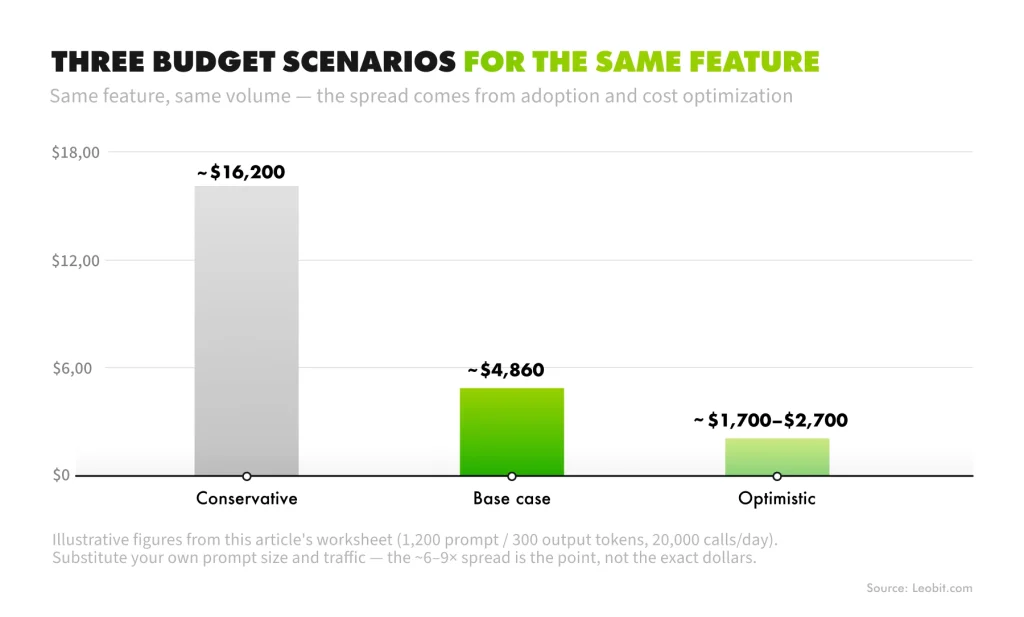
A better approach is to budget three scenarios instead of one.

What changes
Illustrative monthly cost*

Conservative

Adoption exceeds plan by ~30%, no cost optimizations yet, occasional use of a higher-priced model

~$16,200

Base case

Planned adoption, single model tier, no optimizations

~$4,860

Optimistic

Same usage, with prompt caching and cost-aware model routing in place

~$1,700–2,700

*These figures build on the worksheet example above. Replace them with your own assumptions. The important takeaway isn’t the exact dollar amount; it’s how wide the range can be for the same feature.

Budget scenarios for AI implementation

A single estimate gives stakeholders one number to compare against actual spending. A range gives them something they can plan around. It makes the assumptions visible and acknowledges that AI costs depend on product adoption, engineering decisions, and user behavior—all of which change over time.

One final point: don’t assume future optimizations are already part of the budget. If your optimistic scenario depends on prompt caching, model routing, or other engineering work that hasn’t been implemented yet, call that out explicitly. Otherwise, the budget reflects savings that don’t exist yet.

Unit Economics: How to Tell Whether the Spending Was Worth It

A monthly total dollar figure answers “how much did we spend,” which is rarely the question a CEO or product lead actually needs answered. The more useful question is: Was that spending worth it? Answering that requires breaking the total down into units that can be compared against something.

  • Cost per active user per month. Take the total AI spend for a feature and divide by its monthly active users. If a feature costs $4,860/month (the base-case figure above) and serves 5,000 monthly active users, that’s roughly $0.97 per user per month. This number can be compared directly against subscription revenue per user, or against the cost of whatever the feature replaced.
  • Cost per AI-assisted transaction. This is where the comparison becomes genuinely persuasive for a business audience. Take a support-automation feature: Industry benchmarks put a human-handled support interaction at roughly $6.00, against $0.50 for an AI-handled one, a 12-times unit-economics gap for the ticket categories a model resolves reliably. That comparison is the entire business case in one number, but it only exists if AI cost was tracked per transaction in the first place.
  • Cost per feature call. The most granular unit, and the least useful in a boardroom. But it is the right one for an engineering team tracking whether a specific prompt change or model swap moved cost in the right direction week over week.

The pattern across all three: the total bill tells you what you spent; the unit economics tell you whether you should have. Only the second framing gives C-level executives the information needed to decide whether to expand a feature, leave it alone, or cut it.

Fixed vs. Variable AI Costs: What the Invoice Does Not Show

It’s easy to conflate “AI cost” with “the API invoice,” because that’s the line item that arrives monthly with a clear dollar figure attached. But a complete budget model has to separate costs into two categories that behave very differently over time:

Behavior
Examples

Variable

Scales directly and continuously with usage

API token spend, batch-processing fees, web-search or tool-call surcharges

Semi-fixed

Scales in steps, tied to development cycles

Prompt engineering and evaluation cycles, fine-tuning runs, monitoring/observability tooling, rate-limit tier or contract upgrades

The variable column is what shows up on the provider’s invoice, and it is where most estimates stop. The semi-fixed column appears nowhere on that invoice. It shows up as engineering hours and contract line items scattered across other budget categories, which is exactly why it gets left out of AI cost estimates even though it is just as real.

A feature with a modest token bill can still be expensive to operate responsibly if it needs ongoing prompt maintenance and evaluation to run safely.

Volume commitments vs. pay-as-you-go

Most AI providers offer lower prices if you commit to a certain level of monthly spending. Enterprise agreements often come with additional benefits, such as higher rate limits and priority support. If your usage is predictable, these discounts can significantly reduce operating costs.

The trade-off is that you’re committing to spend money whether you use it or not. If adoption grows more slowly than expected, a pricing discount quickly becomes a fixed cost.
This is where the three-scenario budget becomes more than a forecasting exercise—it becomes a decision tool.

Suppose a provider offers discounted pricing in exchange for a $10,000 monthly commitment. Based on the examples from the previous section:

  • Conservative: ~$16,200/month
  • Base case: ~$4,860/month
  • Optimized: ~$1,700–2,700/month

The base case doesn’t justify the commitment. Only the conservative scenario exceeds the threshold.

A practical rule is to negotiate committed pricing only when you’re confident your long-term usage will consistently exceed the minimum spend. If reaching the threshold depends on aggressive adoption forecasts or engineering work that hasn’t been completed yet, pay-as-you-go is usually the safer option.

The discount should reflect demand you’ve already validated, not demand you hope to have in the future.

How Leobit Can Help With AI Budget Planning

Estimating AI costs is difficult before a feature exists. Prompt sizes, response lengths, and usage patterns are all assumptions at that stage, yet they determine most of the operating cost.

That’s where experience makes a difference. Having designed and delivered ⁠AI solutions across a wide range of projects, Leobit’s engineers can help estimate realistic token usage, compare model options, and identify the decisions that will have the biggest impact on long-term costs. Instead of relying on a single estimate, we build cost scenarios that reflect different adoption levels and make the underlying assumptions explicit.

Whether you’re evaluating the business case for your first AI feature or trying to understand why an existing one costs more than expected, ⁠our team can help you build a realistic cost model before those assumptions turn into production expenses.

Conclusion

AI cost overruns usually aren’t caused by unpredictable technology. More often, they’re the result of planning with incomplete information. Teams estimate usage, but overlook the factors that actually determine how much an AI feature will cost to run.

A better approach is to make those assumptions explicit. Estimate the five cost drivers, calculate the cost of a single request, and model multiple adoption scenarios instead of relying on a single number. You won’t predict the future perfectly, but you’ll have a budget that’s much closer to reality—and much easier to update as the feature evolves.

This article focused on budgeting before launch. In the final article of this series, we’ll look at what happens after deployment: the engineering techniques that reduce AI costs in production, from prompt caching and model routing to other optimizations that improve efficiency without compromising quality.

FAQ

Start by estimating five variables: prompt size, response length, call frequency, model pricing, and expected feature growth. Calculate the cost of a single request, multiply it by projected usage, and model at least three scenarios—conservative, expected, and optimized—instead of relying on a single estimate.

It depends on the feature, but prompt size and call frequency are often the biggest drivers. Hidden input tokens, such as system prompts, tool definitions, and retrieved context, are billed on every request, while higher usage multiplies those costs as adoption grows.

Most budgets are based on a single usage scenario. As more users adopt the feature, interact with it more frequently, or new capabilities are added, costs rise beyond the original estimate. That’s why budgeting multiple scenarios is usually more reliable than planning around one number.

Only after your usage has consistently reached the provider’s minimum commitment. If the discount depends on optimistic adoption forecasts or future engineering optimizations, pay-as-you-go is generally the lower-risk option.

Variable costs scale with usage, including token consumption, model inference, and API calls. Other costs, such as prompt optimization, evaluation, monitoring, and infrastructure, don’t grow with every request but still increase as an AI feature becomes more sophisticated. Both should be included in long-term cost planning.